🏁 A Scoreboard with Custom Statsitics for Basketball Games
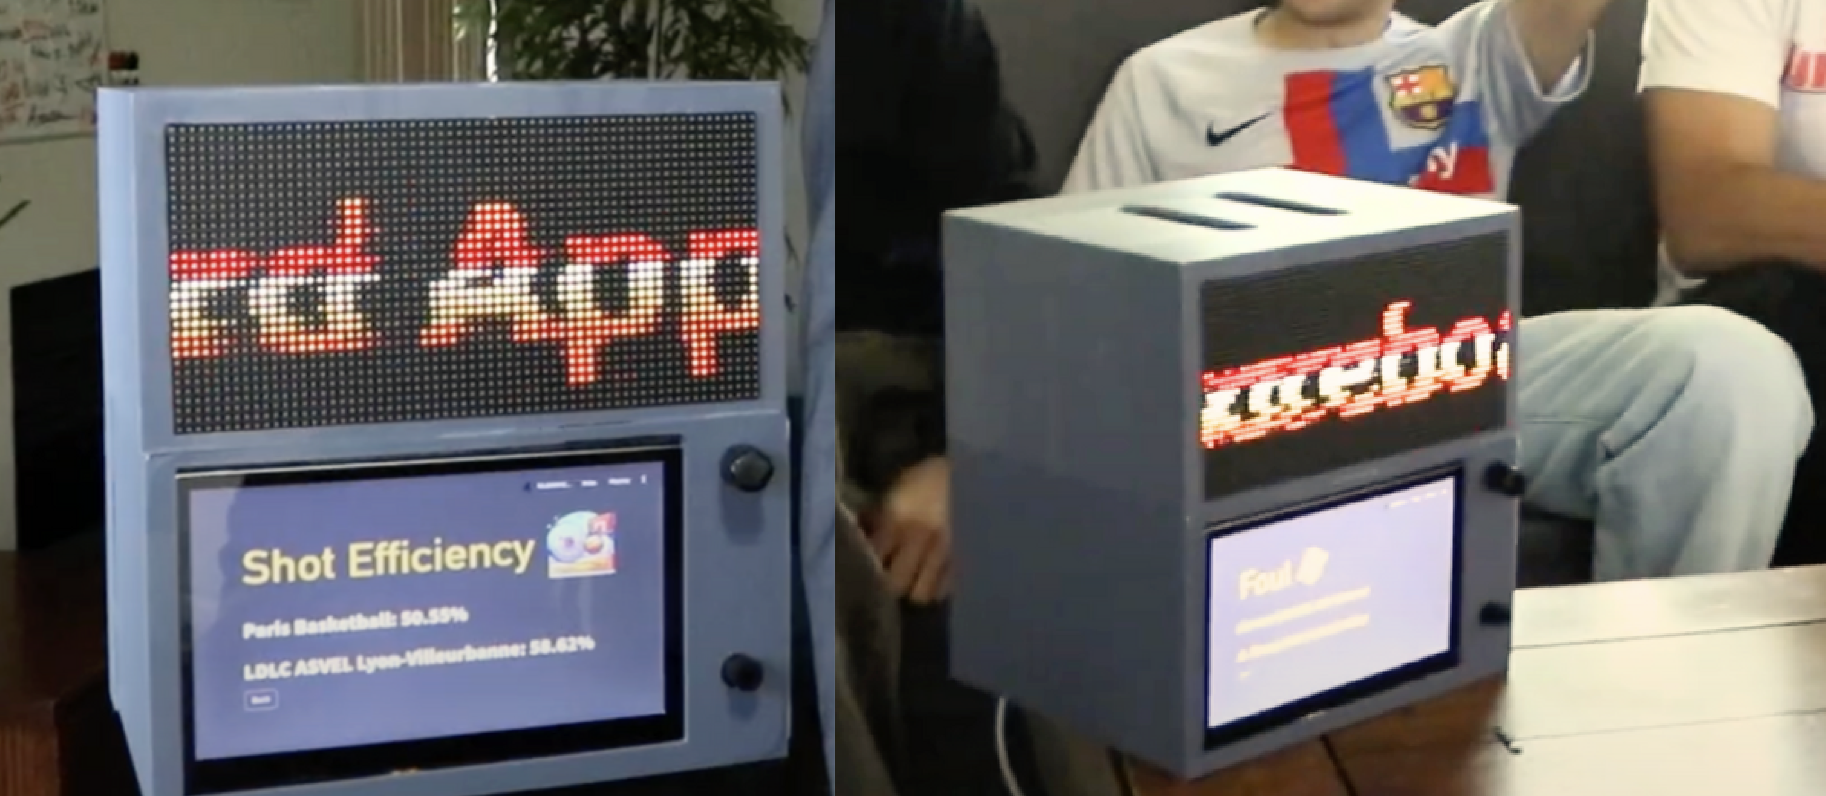
The Adaptive Scoreboard Appliance (ASA) combines hardware and software to provide the ultimate basketball viewing experience. The ASA utilizes a Raspberry Pi and Streamlit interface to provide real-time, custom statsitics to basketball fans. Other features include a dual-screen setup with retro LED display and 3-D printed enclosure.
The ASA brings basketball fans together, allowing them to connect with the game at a deeper level than possible before. It features games from all leages, all levels, and all countries. Ultimately, the ASA is the first smart home device for the diehard sports fan.
During the development of this project, our goal was to have a heavy focus on product. Accordingly, we made a commercial for the ASA, which you can watch here 🎥!
🔑 Key Features
Seven Proprietary Statistics
The ASA implements seven custom-made statistics to analyze the game at a granular level. These include the Player Shotmap, Hot Hands, Bum, Fun Fact, Match Odds, Foul, and Shot Efficiency metrics. All of these statistics are calculated through unique algorithms and large language models (LLMs). Advanced data visualization was utilized for the Player Shotmap, which shows made/missed shots on a map of the court.

Raspberry Pi and Hardware Integrations
The ASA is powered by a Raspberry Pi, which is a single-board computer. A button and potentiometer (dial/knob) were wired to the Raspberry Pi to provide hardware controls. These hardware components are housed in a custom 3D printed enclosure made of sustainable PLA filament. It was printed at the UC Davis Engineering Student Design Center.

Dual Screen Display
The ASA has a dual screen display, with the upper screen being a special Matrix LED. This display gives the ASA a retro look and emphasizes the product-based approach we took with this project.
💻 Code
To obtain Basketball data, we use a maintained API endpoint from Rapid API with robust data and real-time data streaming. This API provides data for matches around the world and several leagues.
We use a variety of Python libraries, such as Pandas and MatPlotLib, to craft the statsitics. Below is a snippet of the code used to calculate match shot efficiency.
unparsed_data = player_statistics_data(match_id)
home_players = unparsed_data['home'].get('players', [])
away_players = unparsed_data['away'].get('players', [])

    def get_team_efficiency(players):
        total_field_goals_made = sum(
            p['statistics'].get('fieldGoalsMade', 0) for p in players)
        total_field_goal_attempts = sum(
            p['statistics'].get('fieldGoalAttempts', 0) for p in players)
        total_free_throws_made = sum(
            p['statistics'].get('freeThrowsMade', 0) for p in players)
        total_free_throw_attempts = sum(
            p['statistics'].get('freeThrowAttempts', 0) for p in players)
...
Below is another snippet of code used to create a visualization for the player shotmap.
unparsed_data = shot_map_data(match_id, team_id)
x_made = []
y_made = []
x_missed = []
y_missed = []
for x in unparsed_data.get('shotmap', []):
    if x.get('made') == True:
        x_made.append(x.get('x'))
        y_made.append(x.get('y'))
    else:
        x_missed.append(x.get('x'))
        y_missed.append(x.get('y'))

return {
    'made': {'x': x_made, 'y': y_made},
    'missed': {'x': x_missed, 'y': y_missed}
}
Ultimately, all seven statsitics were implemented using data from the real-time API endpoint. The frontend of the project was crafted in Streamlit, a Python framework for frontend development.
stat_title = st.empty()
placeholder_home_player_statistics = st.empty()
placeholder_away_player_statistics = st.empty()
placeholder_shot_map = st.empty()
...
Finally, after implementing the statsitics and frontend experience, we connected the software to the hardware controls for the push button and potentiometer.
GPIO.setwarnings(False)
GPIO.setmode(GPIO.BOARD)
buttonPin = 37
GPIO.setup(buttonPin, GPIO.IN, pull_up_down=GPIO.PUD_UP)

while True:
    #state is true or false (1 or 0) depending on if the button is pressed
    state = GPIO.input(buttonPin)
    #prints 1 when the button is not pressed, and 0 when it is
    print(state)

    time.sleep(.5)
After setting up this code on the Raspberry Pi and wiring the hardware components properly, development on the ASA was completed.
🪴 Areas of Improvement
- Frontend Design: The frontend design for the scoreboard is adequate, but given more time, we would have liked to make the design match the general brand guidelines of our marketing.
- Polishing Details: The box enclosure is missing a back panel, which exposes the Raspberry Pi and wiring from behind. In the future, we plan to 3D print a back panel to create a sealed enclosure.
- Matrix LED Screen: Unfortunetly, the Matrix LED screen we received is a defective unit. This causes the screen pixels to glitch out and look subpar.
🚀 Further Uses
- The project can be implemented to support all sports, including baseball, soccer, hockey, cricket, and more.
- The ASA could be adapted to support features on conventional home devices, such as voice controls and audio.
💻 Technology
- Raspberry Pi
- Potentiometer
- Push Button
- Streamlit
- Pandas
- MatPlotLib
- GPT-4o